
Sleep Tracking
Anita Lillie's final project for Sensor Systems for Interactive Environments (Spring 2007)
May 22, 2007
Background and motivation
This project was motivated by two things: my almost complete inability to get out of bed in the morning, and my fondness for recording data from routine activities and making graphs with that data.
My main problem with waking up in the morning is that feeling of grogginess along with an intense desire to sleep more. However, I've noticed that sleeping without an alarm clock, and just waking up whenever I wake up, helps. And I've also noticed that sometimes when I wake up I am dramatically more refreshed than usual. Reading about sleep on the web led me to learn more about sleep cycles. One interesting page ("The power of the Sleep Cycle") claimed that it wasn't the amount of sleep one gets, but the part of the sleep cycle we wake up in. The author suggested that, because we sleep in cycles about 90 minutes long, we should aim to wake up in the transition between sleep cycles, since the brain is more alert and refreshed at that time. He quotes from the Center for Applied Cognitive Studies:
"Studies show that the length of sleep is not what causes us to be refreshed upon waking. The key factor is the number of complete sleep cycles we enjoy. ...A person who sleeps only four cycles (6 hours) will feel more rested than someone who has slept for 8 to 10 hours but who has not been allowed to complete any one cycle because of being awakened before it was completed.... "
Picture of the sleep cycles:
Here's another paper of which I have since learned, that describes a "wearable interface for controlling the awakening time"
based on this hypothesis:
Biorhythm-Based Awakening Timing Modulation
Goal
The length of the sleep cycle varies for each person, and averages about 90 minutes. I wanted to try to measure the length of mine, without having to wake up and check a clock. I also wanted to get an idea of how much I naturally move around during the night, and what patterns I might find therein.
Procedure
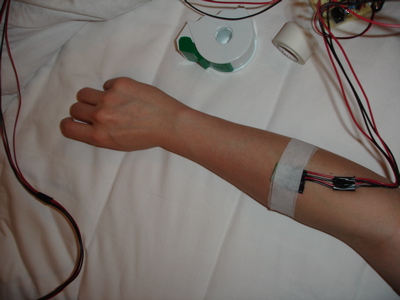
To investigate this, I outfitted myself with sensors that would help me determine how my position changes over the course of a night's sleep. I used three accelerometers as tilt sensors, placed on three different places on my body: my forehead, my forearm, and my upper leg.
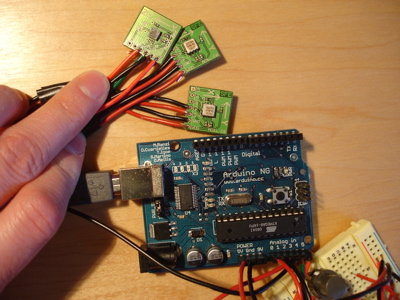
Here is one of the accelerometers I used (Accelerometer Breakout Board - ADXL202JE +/-2g from Spark Fun Electronics):

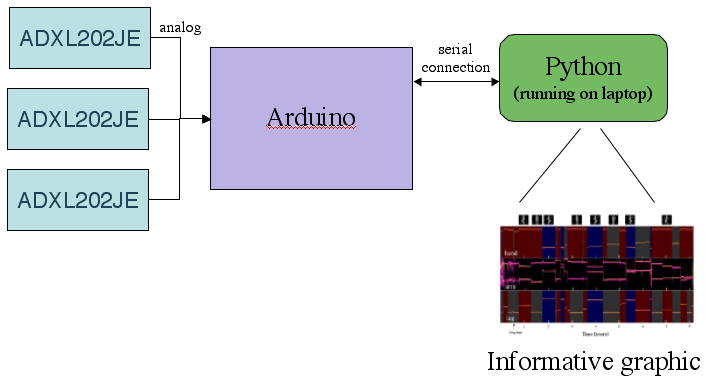
I recorded the analog data from the x- and y-axis for all three accelerometers by feeding them into the Arduino board (which uses an ATMEGA8 chip). (The breadboard in the corner was used to provide power to all the accelerometers.):
Here I am wearing one of the sensors on my head, and another on my arm, secured with medical tape:

And here's everything connected to my laptop, ready for a night of sleep:
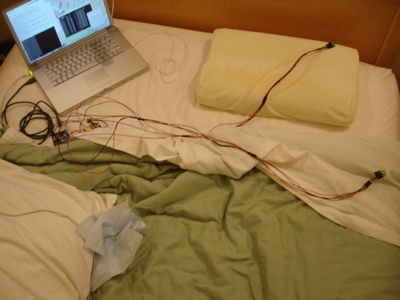
From these three accelerometers, I recorded data onto my laptop as fast as I could (~30 Hz). After 8+ hours of recording, I had almost one million samples (25-30 MB of text). I accumulated two nights worth of data, but hope to collect more.
Analysis, results
All my processing and analysis was done in software I wrote in Python and Pygame, which parses the data set and creates graphs that categorize the sensor readings into sleep positions, and highlights them accordingly. The graphs show raw data, smoothed data, and color-code positions automatically.
For each axis I measured, I looked at the data from a "calibration sequence" that I completed each night that I slept hooked up to the system. Here's that sequence for the forehead accelerometer:
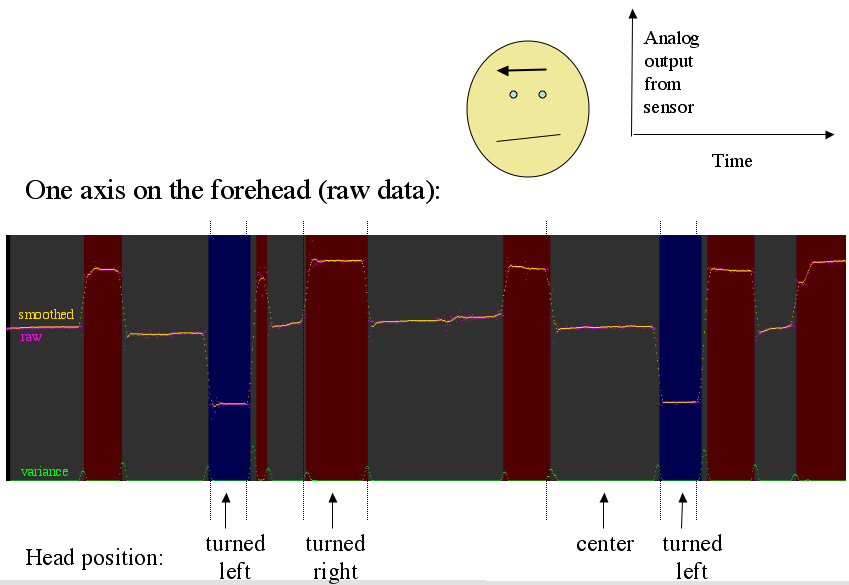
It's clear in this plot that there are distinct horizontal bands of sensor readings that correspond to specific head positions, creating clear vertical bands when the position is held for more than a few minutes. By matching plots like the one above with notes I took of time/activity during the calibration period, I was able to determine which ranges of values from the accelerometers mapped to particular body (or body part) positions, and add this information to my information visualizer program.
Because each night consisted of almost a million samples, the full-night graphs took an hour to produce with my python script. But here is one of them:
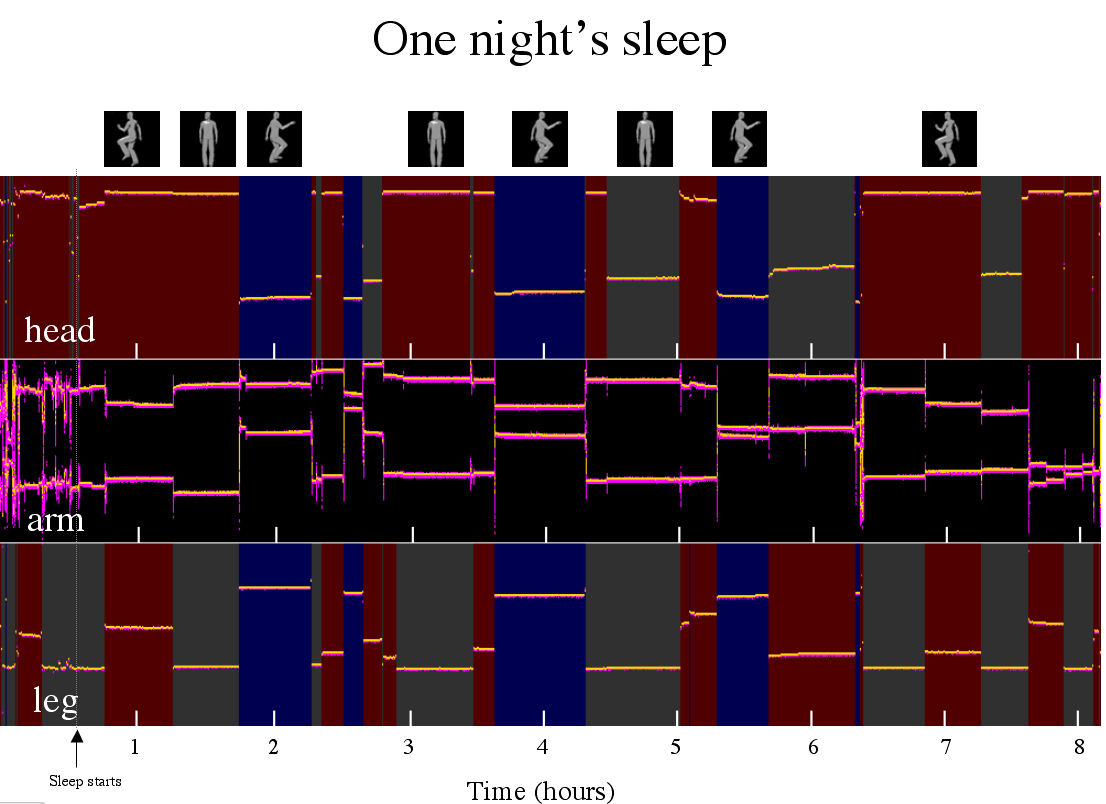
[Red background is head or body (leg) turned to right side; blue is turned to left; gray is centered. General level of arm activity is illustrated in the black center band. I did not attempt to correlate arm movement with particular positions, because the arm took so many different positions.]
From the graph above, you can see vertical bands during which I was completely on my left or right side, and some combinations in between. The 3-D figures at top illustrate some of the positions represented. It's clear that I often spend around 30-45 minutes in one position before switching to a new one. 90-minute sections (a common natural sleep cycle) might correspond to pairs of these positions. It's also interesting to note that my body position changes more and more frequently at the end of the night, as I naturally emerge from sleep. And, I like sleeping on my side.
Ideas for improvement
- Better calibration technique: It's cumbersome to calibrate the thresholds for body positions every night. It would be better if I could be more consistent about their placement.
- Get more data: I can't draw a general conclusion about my sleep cycle length from just a couple of nights.
- Teach the system to learn the body positions, and identify transition states in a smarter way than hard-coded thresholds.
- Look at eye movements, which are likely to be an even better indicator of the sleep cycle.
- Make it wireless so it interferes less with sleep comfort.
Copyright © 2008 by the Massachusetts Institute of Technology. All rights reserved.