Visualizing Music
Ever wondered what a piece of music looks like? For a long time, I've wanted a tool that can visualize the audio structure of music. Here is my most recent attempt at doing that.
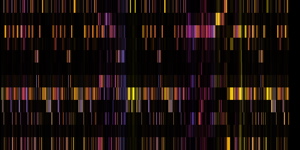
Beethoven, "Moonlight" Sonata: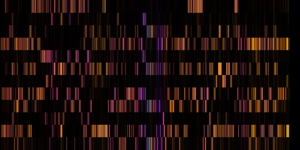 |
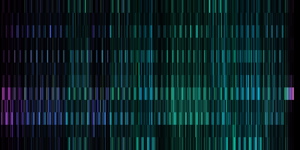
Daft Punk, Superheroes: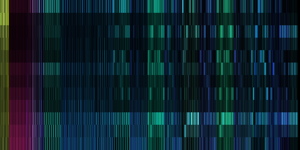 |
Overview
I was able to start this project with a very nice audio analysis tool, courtesy of The Echo Nest. This tool takes an MP3 file, breaks it up into little segments, and gives pitch, loudness, and high-level timbral descriptions of each one of those segments. My program maps a subset of this audio data onto a visual scale (see "Mapping" below), and creates video playback of the song. There are some fun interactive features in the real program, but here I just show pictures and video of the visualizer's basic operation.
I wrote this in python, using pygame.
Mapping
I am visualizing three pieces of data: time, pitch, and timbre.
Time is mapped to the horizontal axis, just as you'd expect. The piece has been broken up into a series of irregularly-sized segments (that are usually about 0.1 to 0.3 seconds long), and those are the vertical slices that you see scrolling past.
Each one of those vertical slices is chopped up into twelve pitches along the vertical axis; these correspond to the twelve semitones in an octave (the chromatic scale). Along the left side of the screen, you can see that each of these chunks is labelled with the corresponding note on a scale. Note that all pitches are compressed into one octave, so notes that are an octave apart appear as the same pitch on the vertical axis. Another result of this is that, series of notes that "run off" the top of the visual space loop back around to the bottom of the space, and vice versa.
Each vertical slice is colored with an RGB value corresponding to the timbre of the sound in that segment. Timbre is what makes, say, a saxophone sound different than a trumpet. The hope here is that the color will capture enough of the variability so that this statement is true: The sounds that sound similar will appear similar in color. You can see from the demos that this works remarkably well sometimes, and is a little confusing at other times.
Screenshots
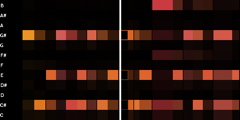
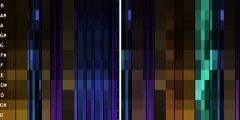
Here's what the program looks like when it's playing back a piece (this is Beethoven's "Moonlight" Sonata):
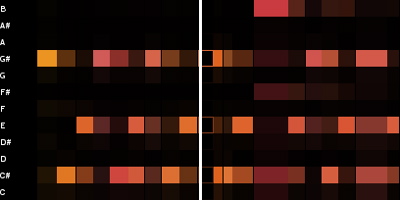
The image scrolls leftwards as the song plays.
The pitches are labelled on the left-hand side.
In the center of the screen is a white vertical line, which represents the current point in the piece. What appears to the left has already played, and what appears to the right is still to come. Under the white line, the pitches are just outlined boxes (instead of filled, like the rest) to aid you in picking out the notes being played. You only see a few seconds of the piece at a time.
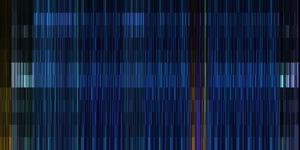
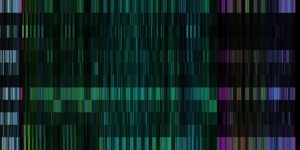
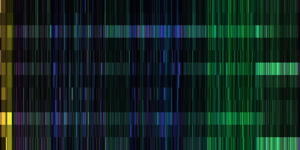
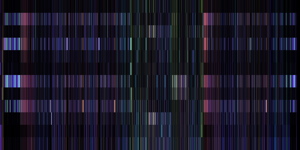
Pictures of songs
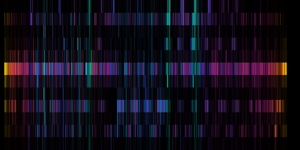
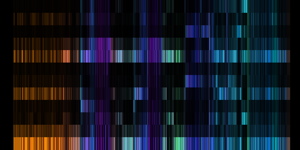
Here are some pictures of full songs, that is, the big picture that the visualizer scrolls through. Much more apparent at this scale are the horizontal stripes that show primary chords and commonly-played intervals, and the colored vertical segments corresponding to changes in timbre.
Video
This QuickTime video is 14.5MB. Click on the image below to load and play it. Or go here to view/download the movie directly. (There is also a high-res version available, about 50MB.)
The video shows playback for short segments of a small selection of songs. You can use the chapter menu in the controls to skip to the piece you're most interested in seeing. Or, you can just play all the way through!
Click on image above to view video. It may take a few minutes to load, depending on your connection speed.
Note: The chapter menu will only be fully usable when the video is done downloading.
Some things to look for in the video:
- Chords as groups of horizontal bars. For example, the beginning of the "Moonlight" Sonatalooks like a piece in C-sharp minor (C-sharp is the second row from bottom), which it is:
- Changes in timbre/color. As the sound of the instruments changes, the color changes to match. A great example of this is in the second clip of Daft Punk's Crescendolls, after the first fade-out: In the Joanna Newsom track, you can see that her voice is bluish, and her harp is pinkish-purple.
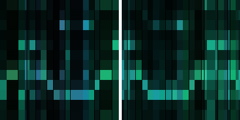
- Happy faces in Nirvana's Come As You Are:
Feel free to post comments on this project on my blog. Or, if you prefer, .
Copyright © 2008 by the Massachusetts Institute of Technology. All rights reserved.

