A music browser that creates maps of music libraries, organizing songs by how they sound. (MS Thesis)
Play with and learn about this amazing curve, and the intriguing patterns that it creates in nature
Shows trends and other information about diagnoses and drug prescriptions.
I volunteered for two summers at a week-long camp for kids age 8-17, where they learn to use power tools and embrace failure.
A blog I kept for a year and a half while at the Media Lab. I blogged (almost) every day about something I learned.
A talk I gave in San Francisco about data visualization thinking and process
Highlights the acoustic structure of musical pieces
Where I wear accelerometers while I sleep, then make graphs of my movements
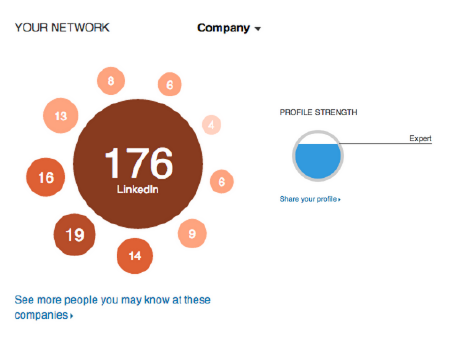
I helped design and code the data vis modules for LinkedIn’s 2012 profile page redesign.
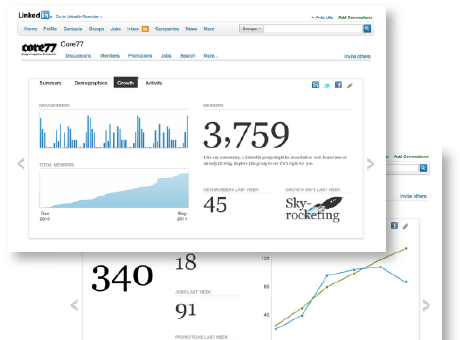
Shows users details about a group's members and activity
Back in the salad days of infographics, all while I was at LinkedIn
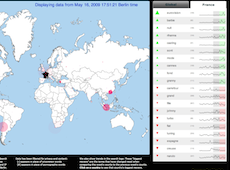
An interactive animation of search phrases on Nokia phones across the world, in delayed real-time
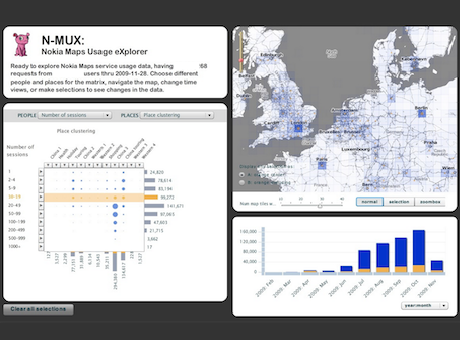
Nokia Maps Usage eXplorer: Shows usage data from Nokia Maps in coordinated views of user segment, map, and timeline
Just some nice maps
Because sometimes you just need a t-shirt
A music browser that shows pictures of the audio inside the songs you listen to every day
A musical instrument that you play with LEDs on your fingertips
I made some nightlights for a couple of my younger friends. Their own art is revealed when turned on.
Track what all your friends are listening to, in one place (with Ian Brown)
A robotic arm that bounces a ball every time it senses one is present